and Automating Surveys
From Kobo to Clarity
Collecting survey data is just the beginning —
Transforming it into real-time actionable insights, is where the impact happens.
About Queryix,
Survey data is only as powerful as your ability to access, understand, and act on it. While Kobo Toolbox provides a reliable way to collect field data, turning that data into real-time, actionable insights often involves manual exports, complex filtering, and static reports.
This showcase introduces a streamlined dashboard module built to bridge that gap.
This showcase introduces a streamlined dashboard module built to bridge that gap.
Problem Statement
Organizations and field teams often rely on Kobo Toolbox to collect critical survey data. However, once the data is collected, teams face challenges like:
Manually exporting and cleaning data after every update
Sharing complex datasets across teams with different access needs
Creating custom dashboards without technical support
Maintaining updated insights from frequently changing responses
These bottlenecks limit how effectively
decisions can be made from valuable survey results.
) From here, we take it further:
From here, we take it further:
Decide which forms matter, filter columns and entries, and turn raw data into actionable tables that is stored real-time, right in your clouds.
Now, How did we manage to do that?
)
)
) And here is where you get the control in your hand!
You see, this is the automated import & update tool. As your data gets gathered by your team, Queryix consistently keeps your instance of the table updated. Simply insert:
A name to set for this tables instance
Upon how many hours, you want to fetch your data
Do you want to refresh in Once or incrementally.
The columns you want to get updated
And here is where you get the control in your hand!
You see, this is the automated import & update tool. As your data gets gathered by your team, Queryix consistently keeps your instance of the table updated. Simply insert:
A name to set for this tables instance
Upon how many hours, you want to fetch your data
Do you want to refresh in Once or incrementally.
The columns you want to get updated
decisions can be made from valuable survey results.
Then let’s demonstrate the solution we came up with!
Let’s say following is a Kobo table. It all begins with the survey data you already have.
With a simple API connection, your Kobo forms appear exactly as they are — structured, and ready to work with.
With a simple API connection, your Kobo forms appear exactly as they are — structured, and ready to work with.
Decide which forms matter, filter columns and entries, and turn raw data into actionable tables that is stored real-time, right in your clouds.
Now, How did we manage to do that?
Manage roles and permissions to keep data
Secure and Relevant.
Let’s see how we can set it up!
)
) By the following two tables you can see how
By the following two tables you can see how
zonal access changes the data for two separate roles
)
)
Secure and Relevant.
We all know the issue when every user gets access to all accumulated data — it clutters the experience, increases security risk, and often leads to confusion.
That’s why our system lets you define who sees what right from the start.
That’s why our system lets you define who sees what right from the start.
1
Admins can view all tables, apply filters, and manage user permissions across the system.
2
New permission sets can be created for roles that are already assigned to each of the users — keeping access structured and scalable.
3
Filter conditions are defined using table attributes (like location or date) or selected from premade logic functions for common use cases.
4
Once roles are configured, users only see the data entries matched to their assigned roles — ensuring secure, focused access at every level.
zonal access changes the data for two separate roles
Build smarter Dashboards that evolve with your data —
filtered by role, and ready to share
filtered by role, and ready to share
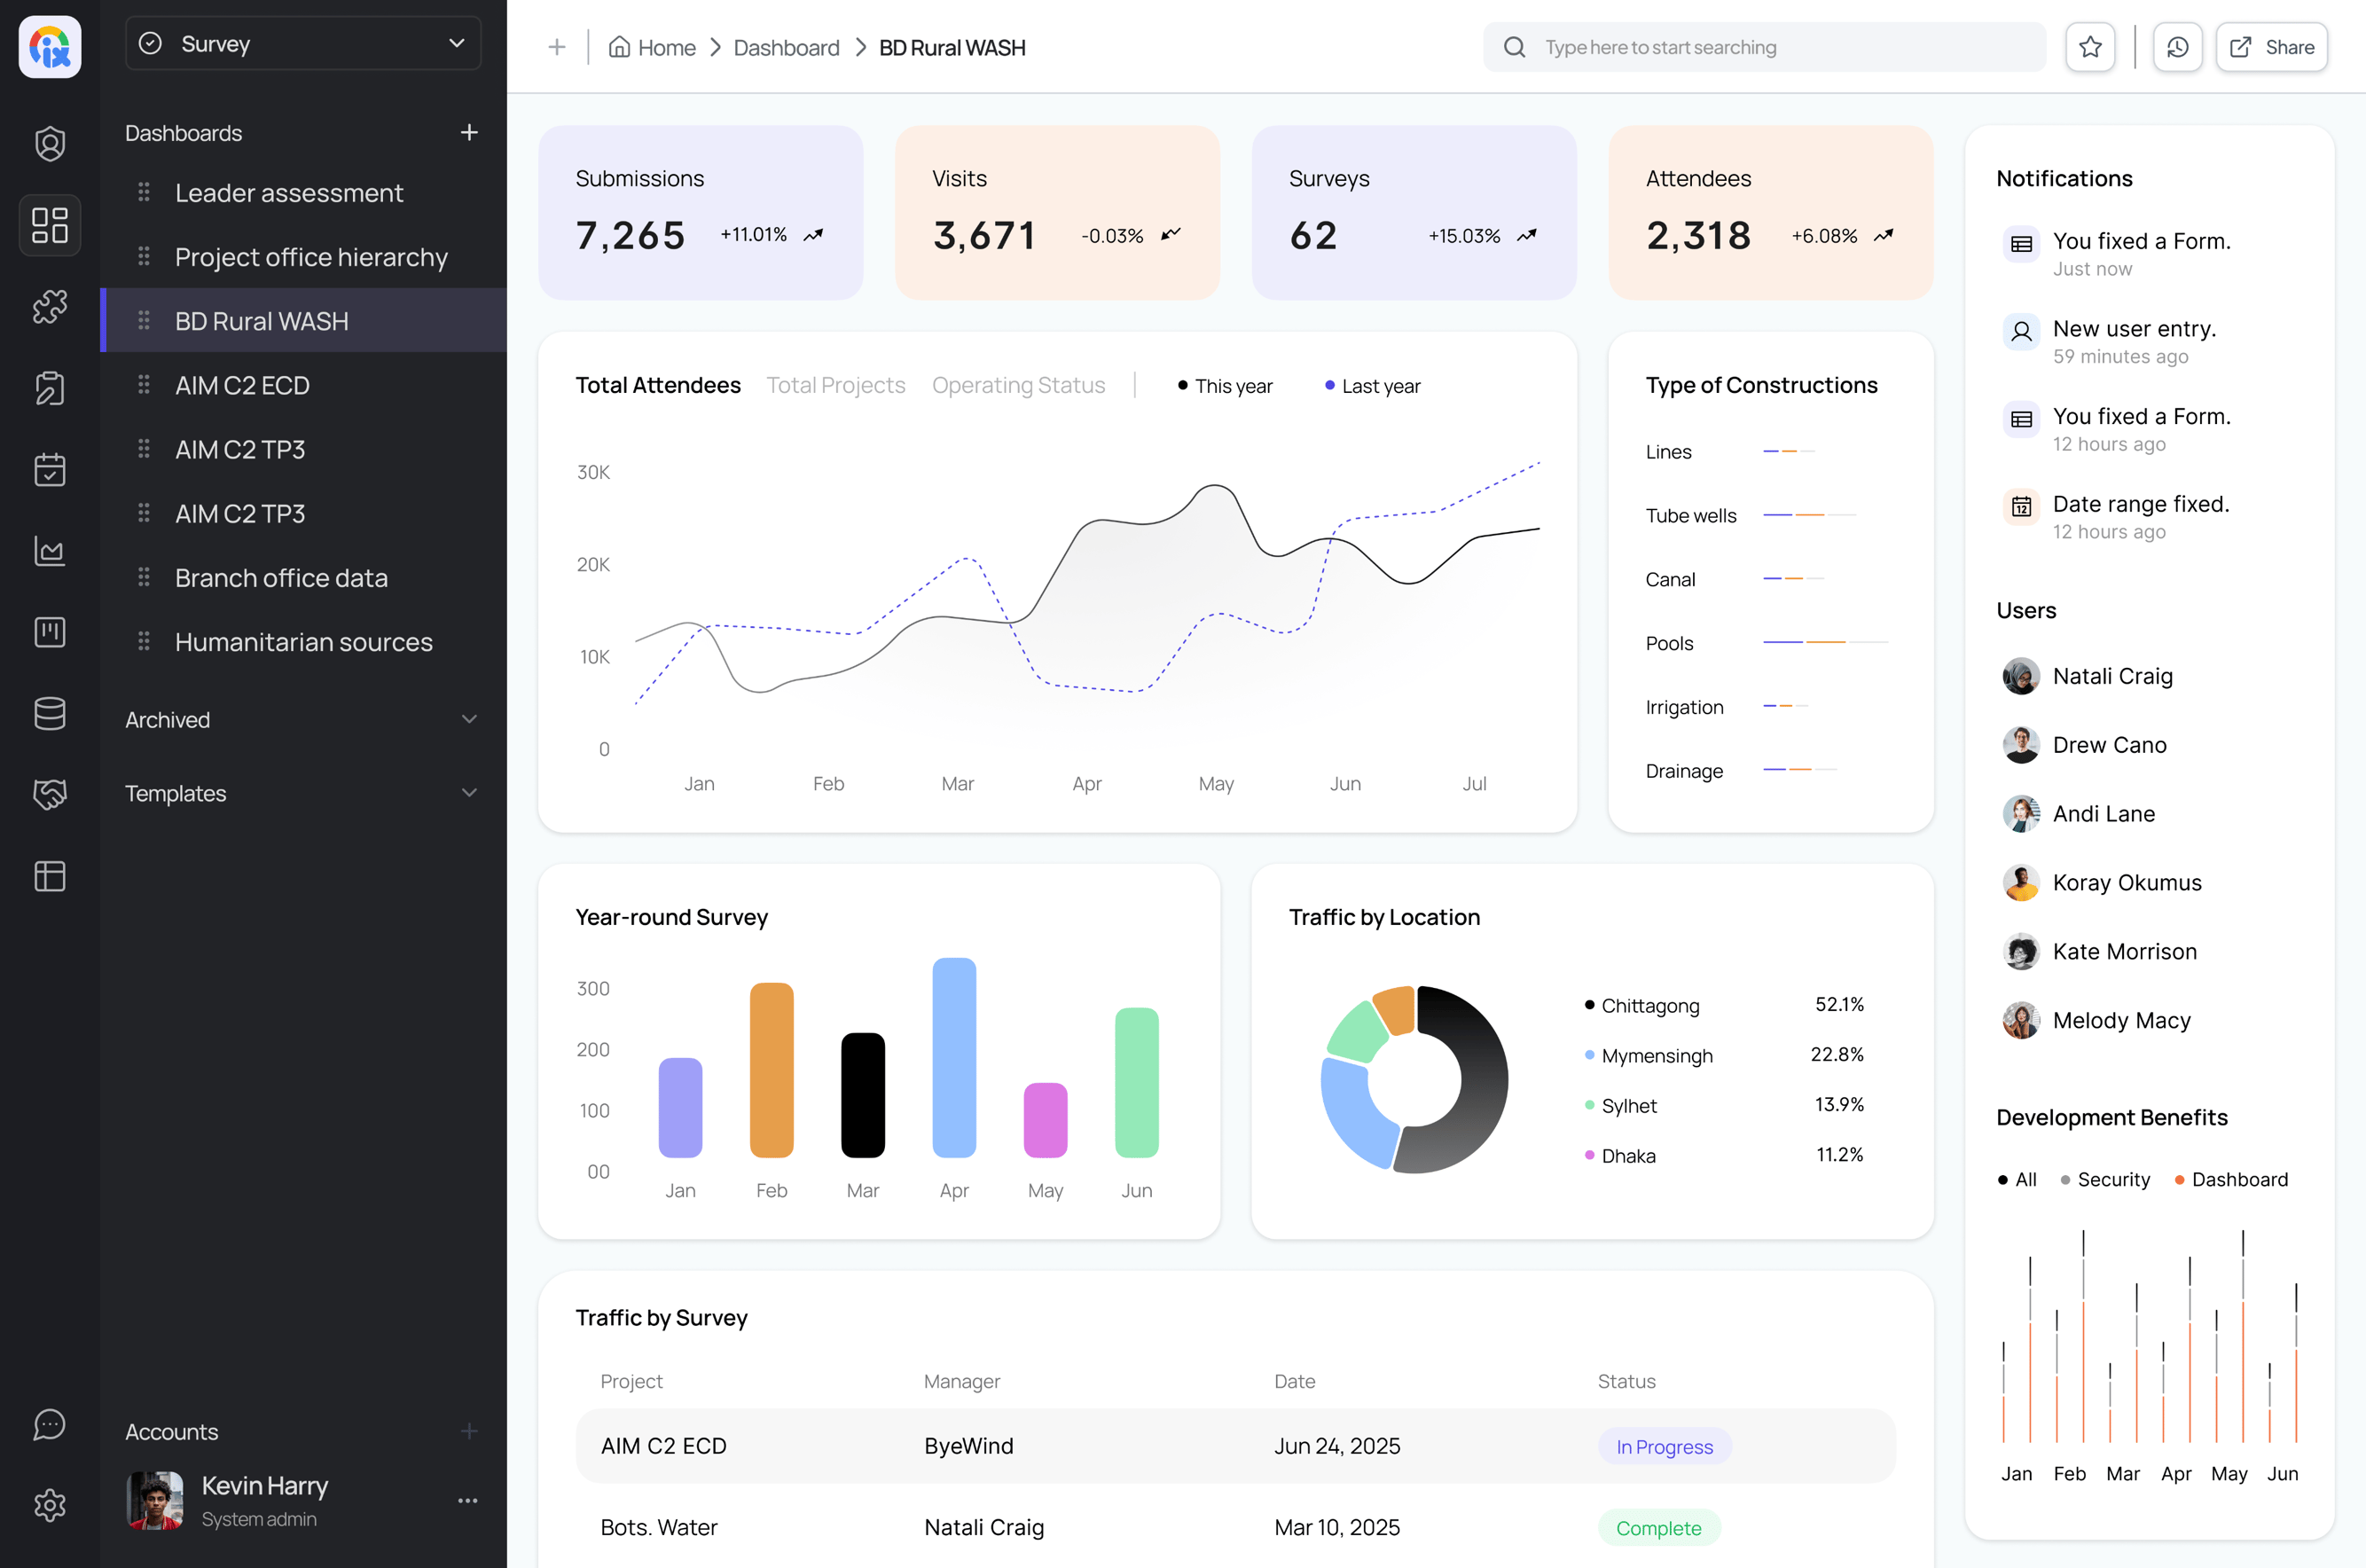
Once your roles are assigned and filters are in place, it’s time to visualize.
The dashboard module lets you turn clean, permission-based tables into custom, auto-updating dashboards. Choose the display for each widget & Organize by department, location, or goals.
The dashboard module lets you turn clean, permission-based tables into custom, auto-updating dashboards. Choose the display for each widget & Organize by department, location, or goals.
Does that look 👀 like
your problem?
your problem?
Let’s Connect
🤝🏻
A project by Streams tech
contact@streamstech.com